01
Remote Detection and Intervention
Cinga enables remote monitoring of equipment, detection of adverse behavior before problems escalate and remote intervention in authorized scenarios.
Cinga collects and analyzes field energy data, turning it into operational decision support for technical teams, managers and decision makers.
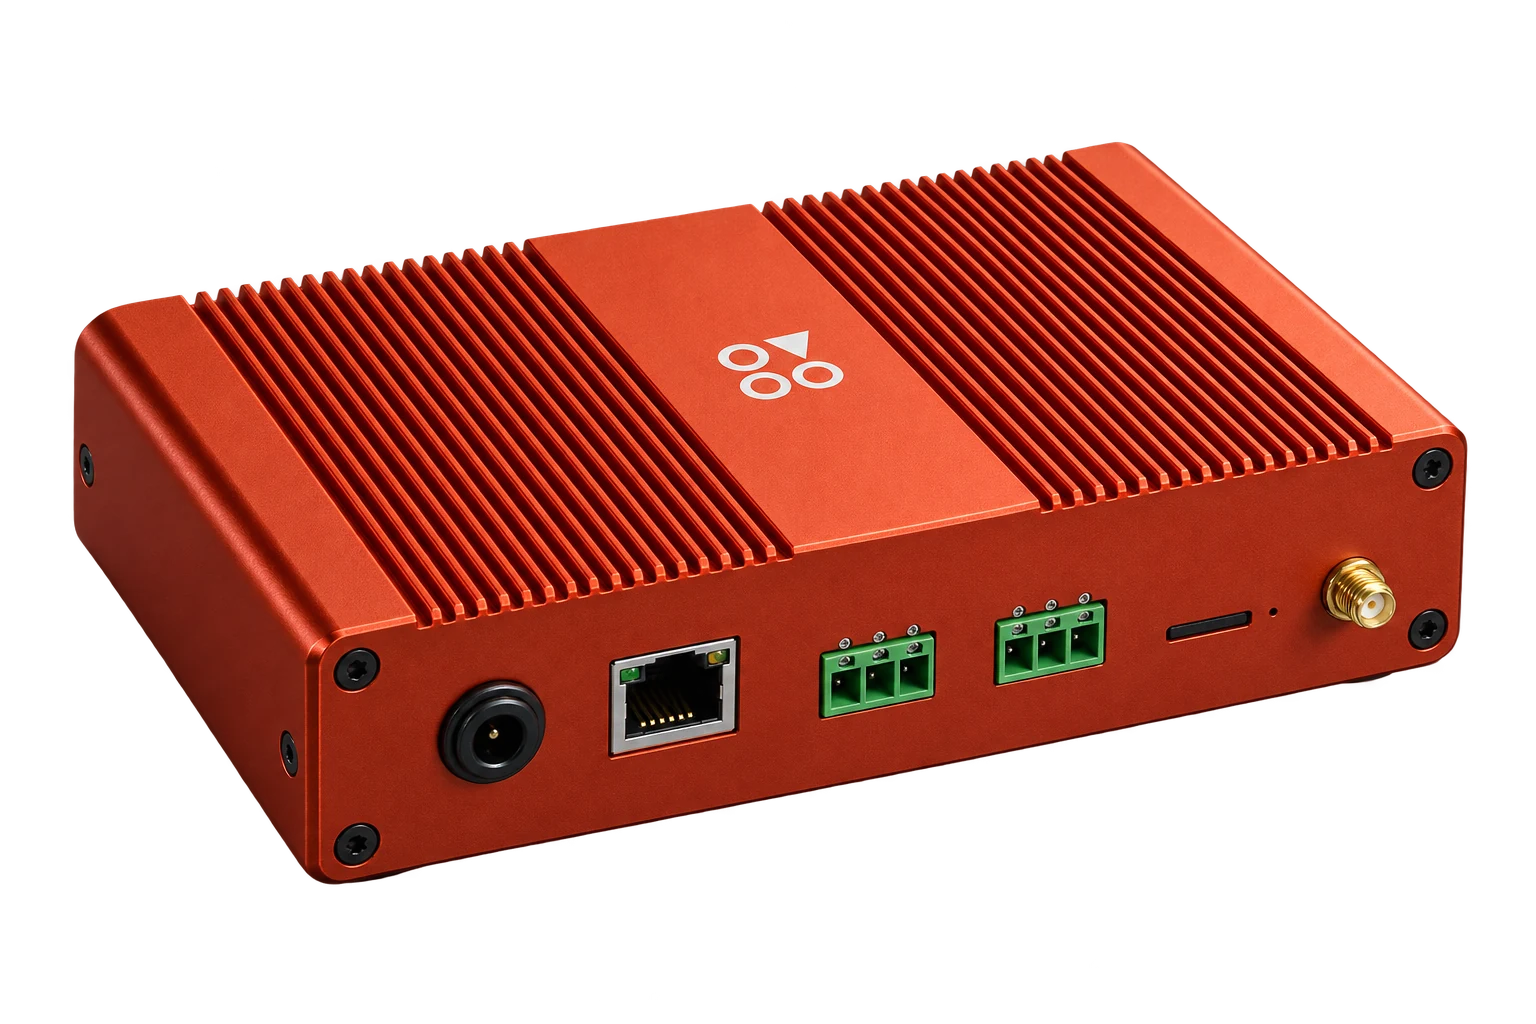
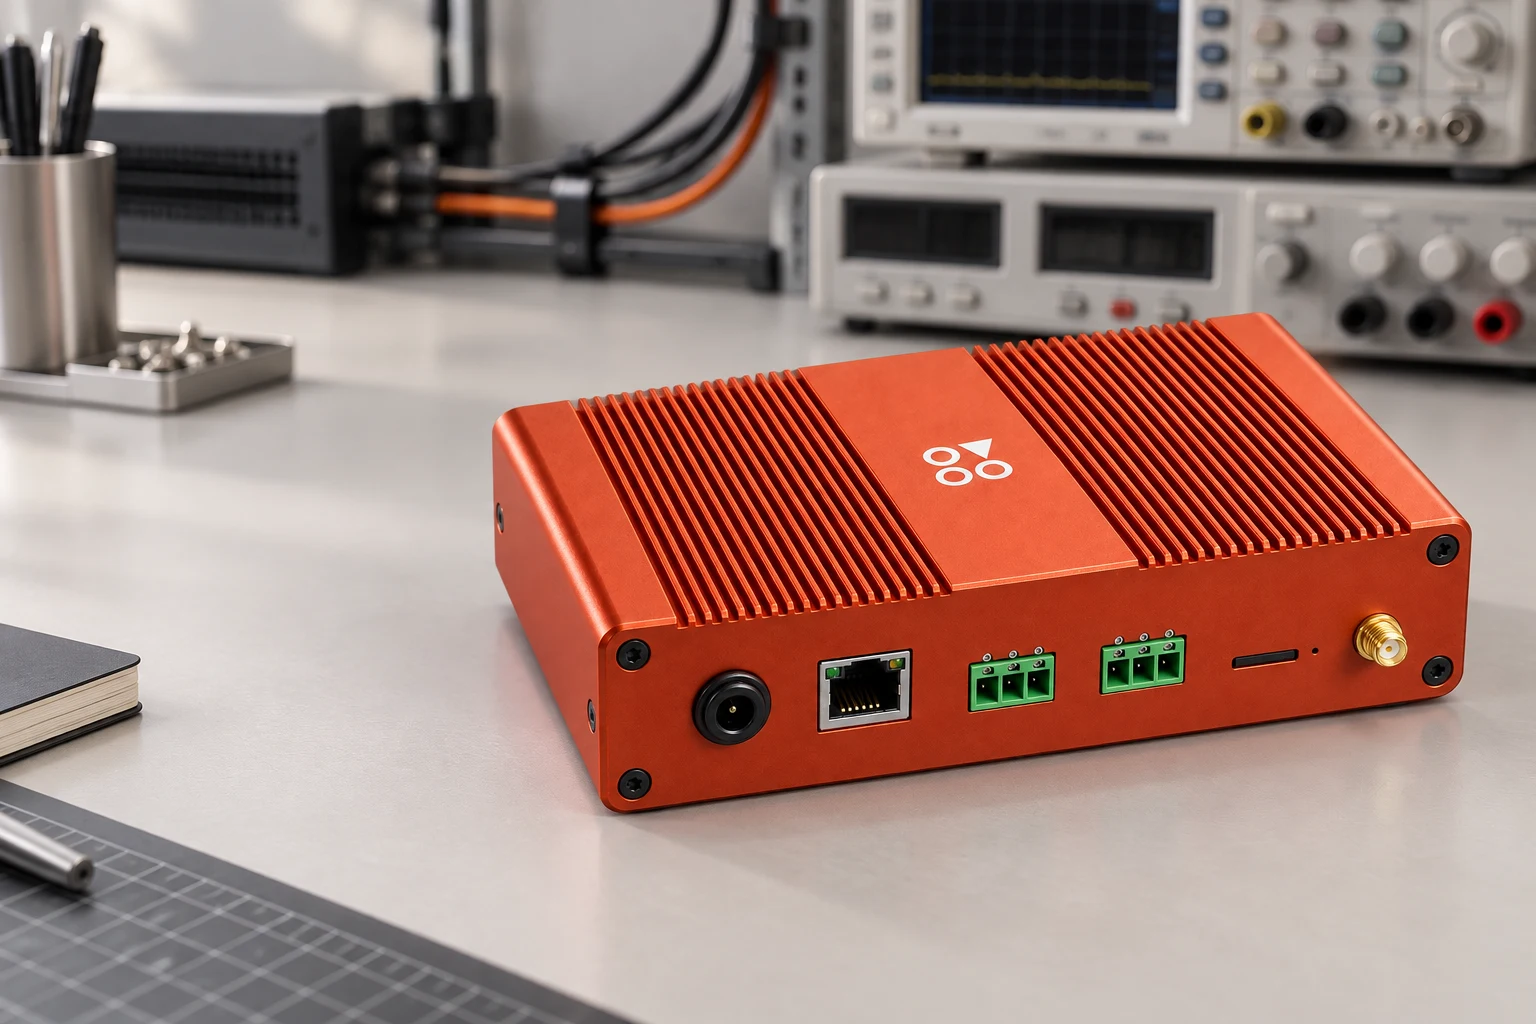
Cinga is an AI-powered energy analyzer and decision support system developed in Türkiye for energy management. It supports more effective management of energy infrastructure and helps protect critical infrastructure and equipment.
Get to know Cinga ↗Cinga connects measurement to analysis and analysis to people. Your field teams and managers access the same information at the level of detail they need.
 CingaAI + ANALYSISData → Insight → Score
Conceptual workflow · AI support and integration scope are defined for each project.
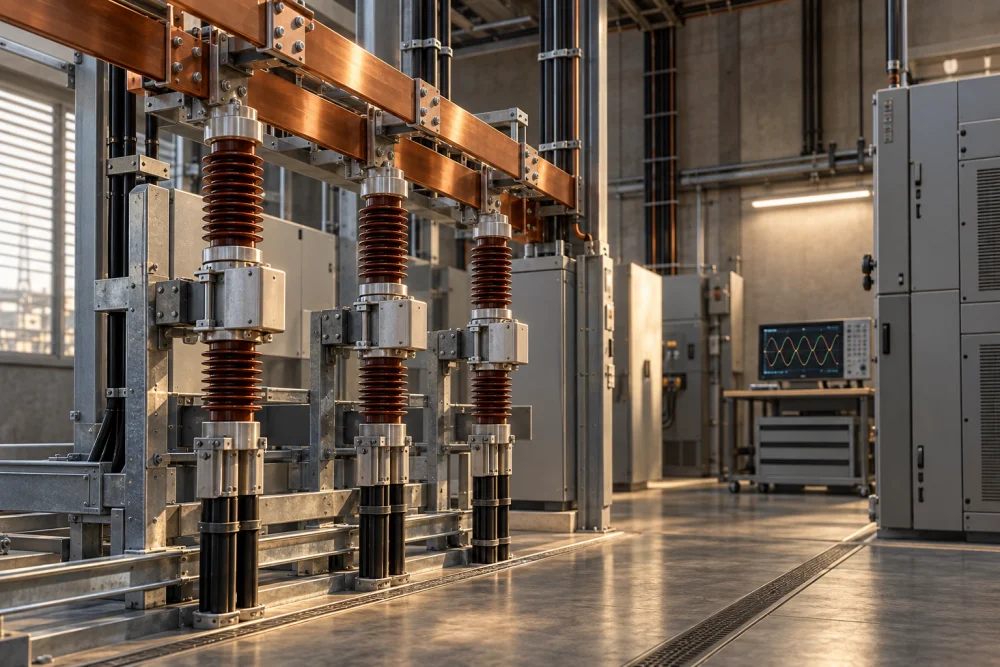
Evaluates the quality of electricity supplied to a facility or equipment.
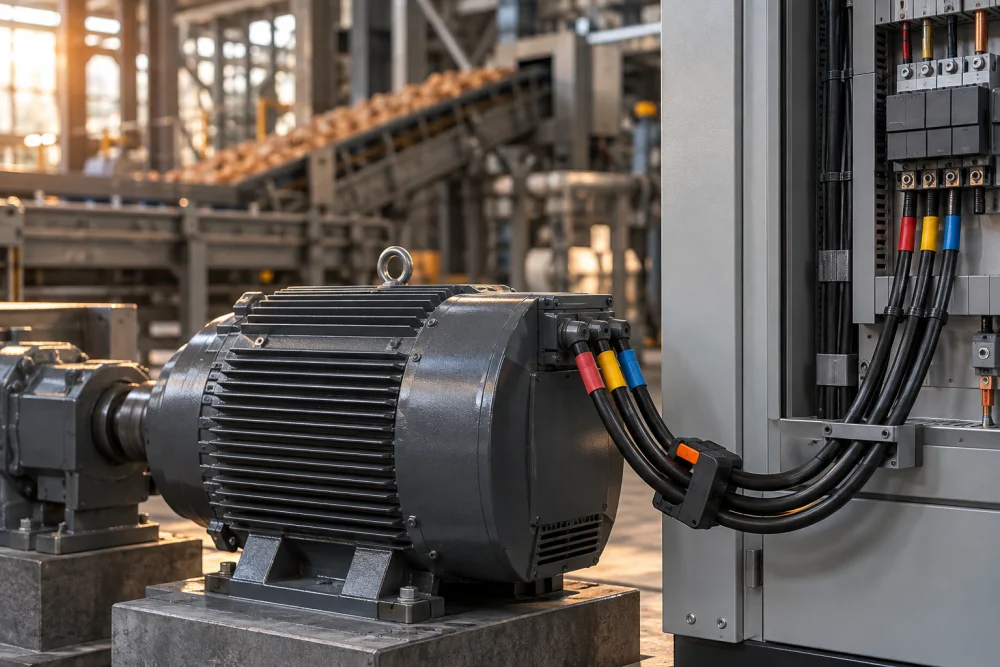
Evaluates how equipment behaves under electrical load.
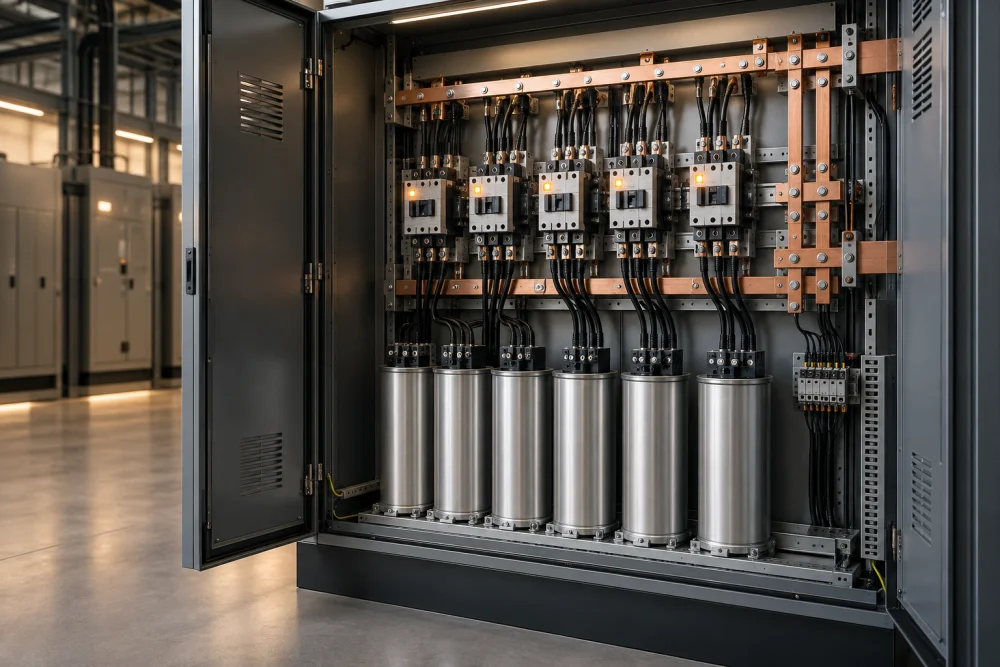
Evaluates reactive power behavior and compensation performance.
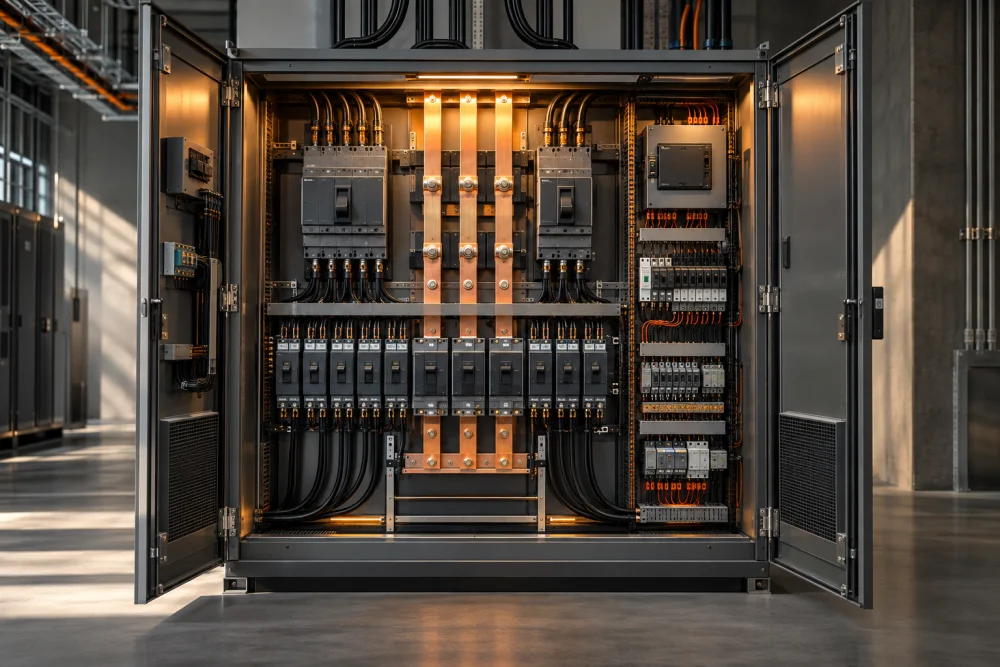
Provides a high-level view of the overall electrical condition of equipment or a monitored point.
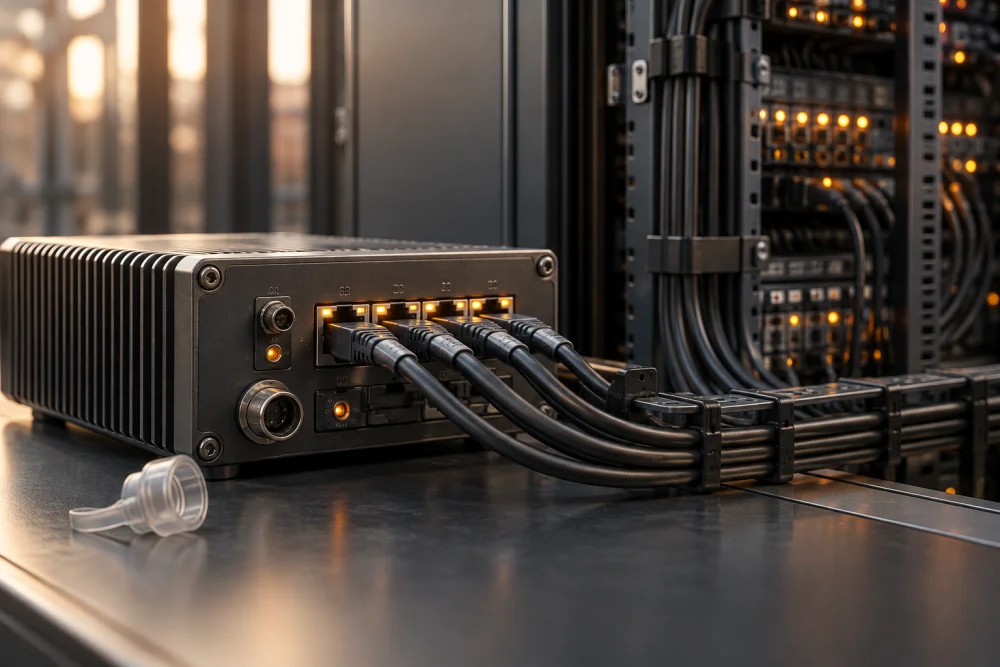
Evaluates the quality of the data underpinning Cinga’s analysis.
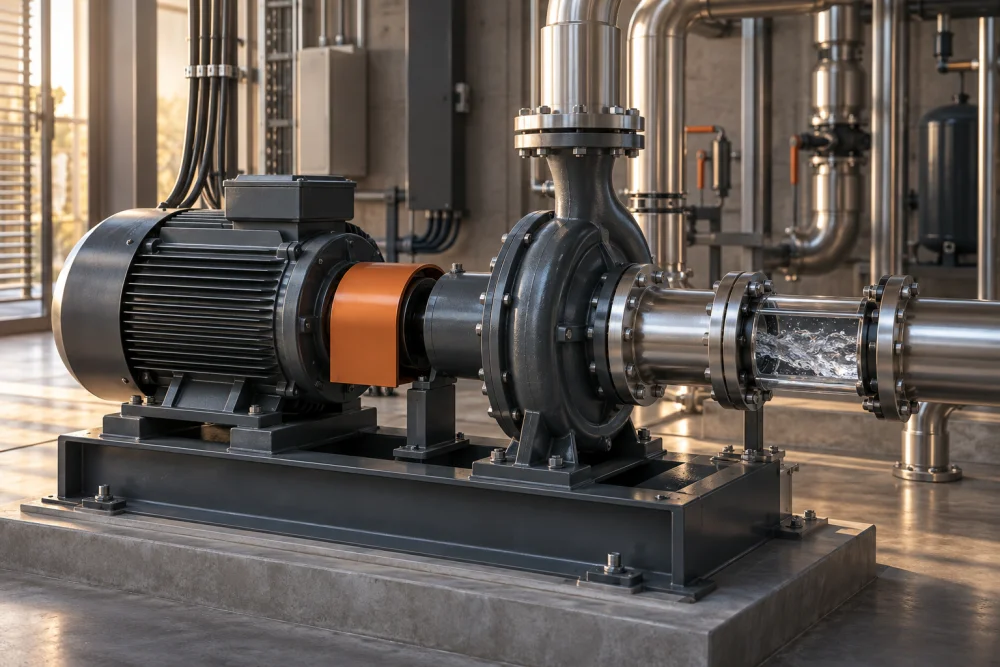
Evaluates the performance equipment or a system delivers in relation to its energy use.
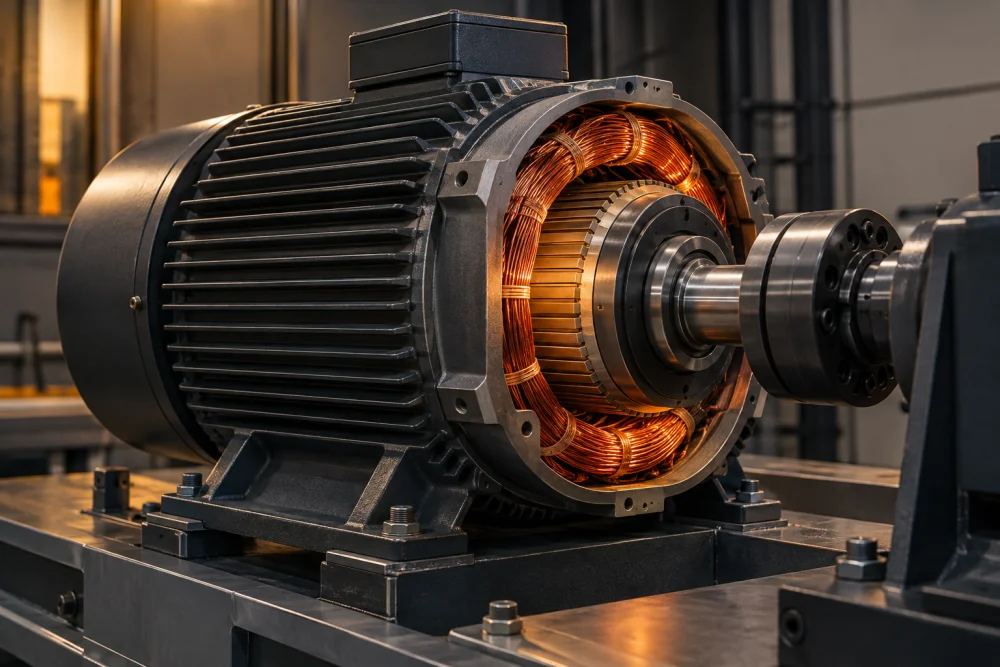
Evaluates the electrical stress a motor experiences during operation.
| Conventional Monitoring | Cinga |
|---|---|
| Instantaneous values and fixed thresholds | Equipment behavior over time |
| Alarm when a problem becomes evident | Earlier visibility into deterioration trends |
| Monitoring individual parameters | Assessing multiple data sources together |
| Interpretation largely depends on personnel | Engineering analysis + AI-assisted interpretation |
| Historical data mainly as a record | History + trend + behavior analysis |
| Priority depends on the user | Scores + intervention priority |
CONVENTIONAL MONITORINGShows what happened.
CINGAShows what changed, why it matters and what needs to be done.
Cinga’s value goes beyond producing more data. Remote detection, early warning, historical analysis and measurable management help businesses manage energy, maintenance, downtime and field operations more effectively.
Cinga enables remote monitoring of equipment, detection of adverse behavior before problems escalate and remote intervention in authorized scenarios.
Helps reduce the risk of unexpected downtime and service loss in critical equipment.
Makes inefficient equipment and unusual consumption behavior visible.
Monitors phase imbalance, power factor, reactive behavior and harmonics.
Helps direct maintenance resources to equipment that requires inspection.
Can help reduce unnecessary site visits, vehicle mileage and staff time.
Enables equipment-level investigation of energy losses and inefficiency.
Supports penalty risk management by monitoring power factor and reactive energy behavior.
Can help reduce emergency maintenance, repeat interventions, spare parts and labor costs.
Allows historical data to be examined to understand when and under what conditions a problem occurred.
Creates a recorded technical history, reducing dependence on individual experience for field knowledge.
Enables data-based answers to “why did it happen and what was done?” alongside “what happened?”.
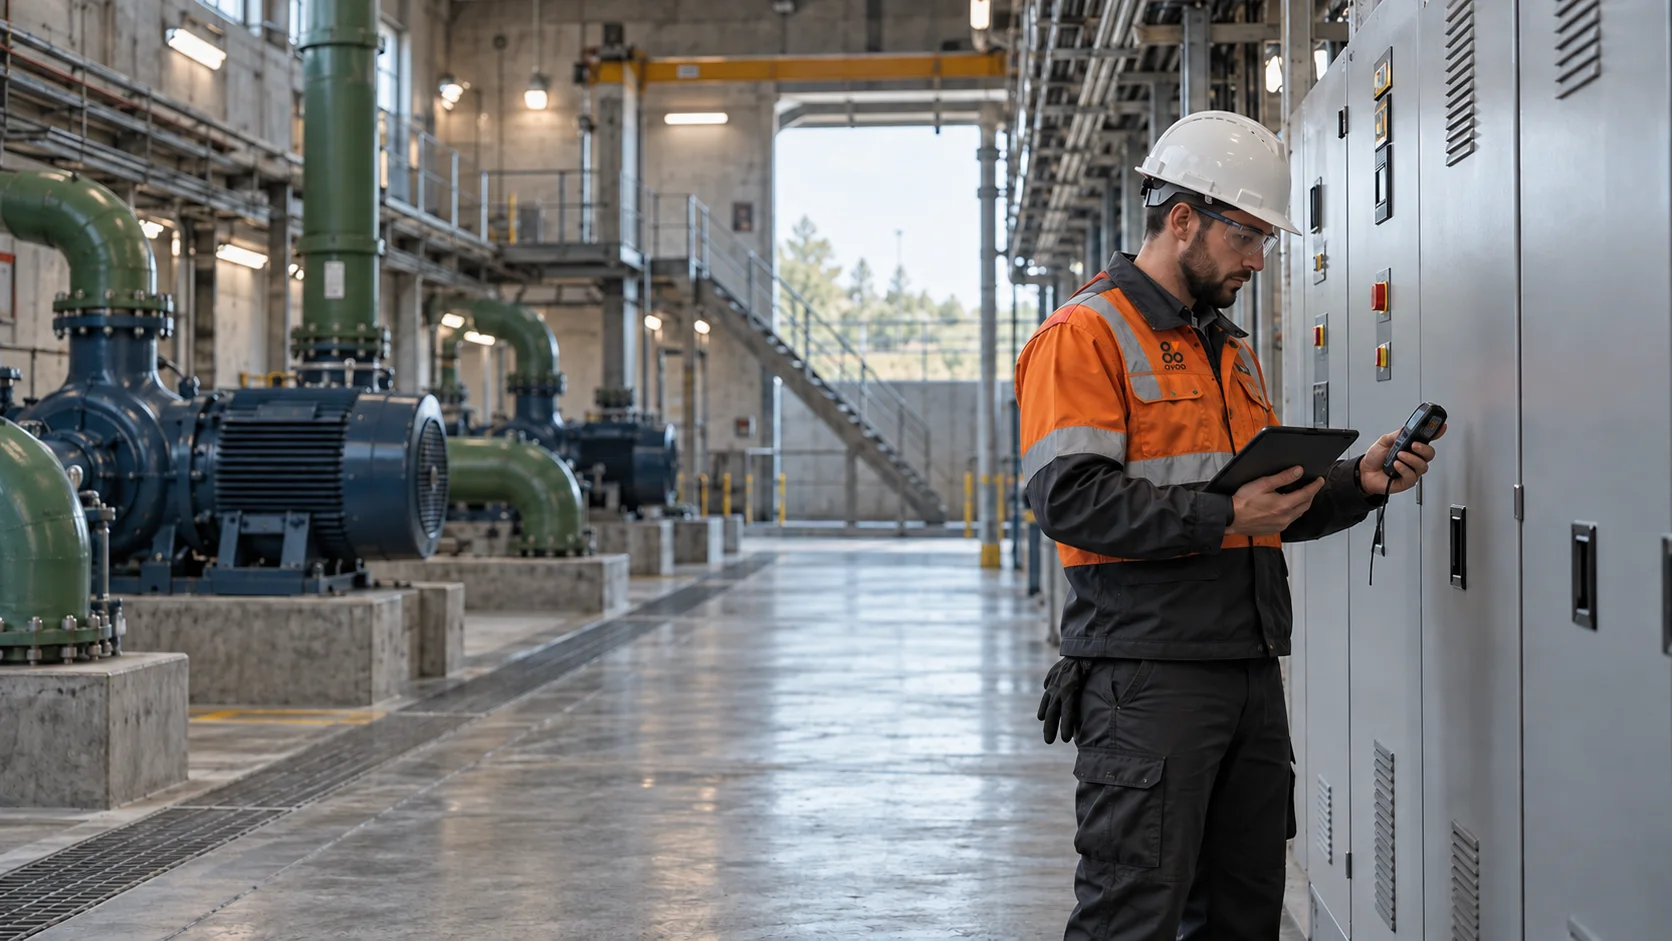
Cinga evaluates field equipment and operating conditions together, analyzing data in the context of real operations.
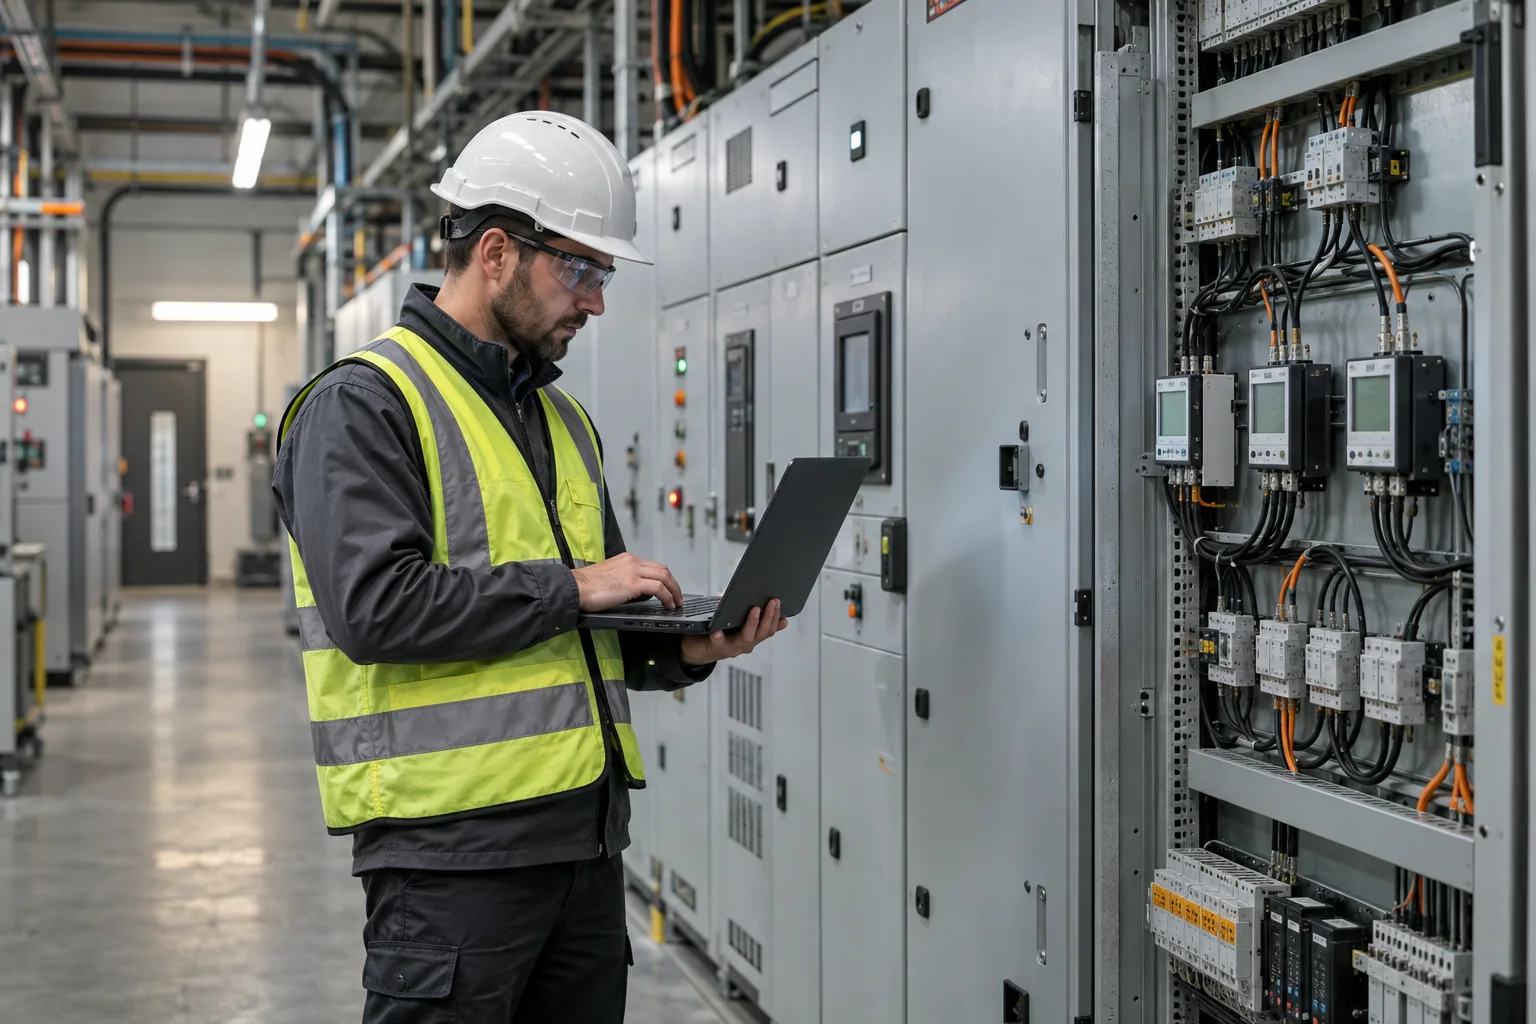 OVOO / INSIGHT 01
Energy data alone is not enough because a measurement becomes a reliable operational decision only when it is connected to equipme…
Read article ↗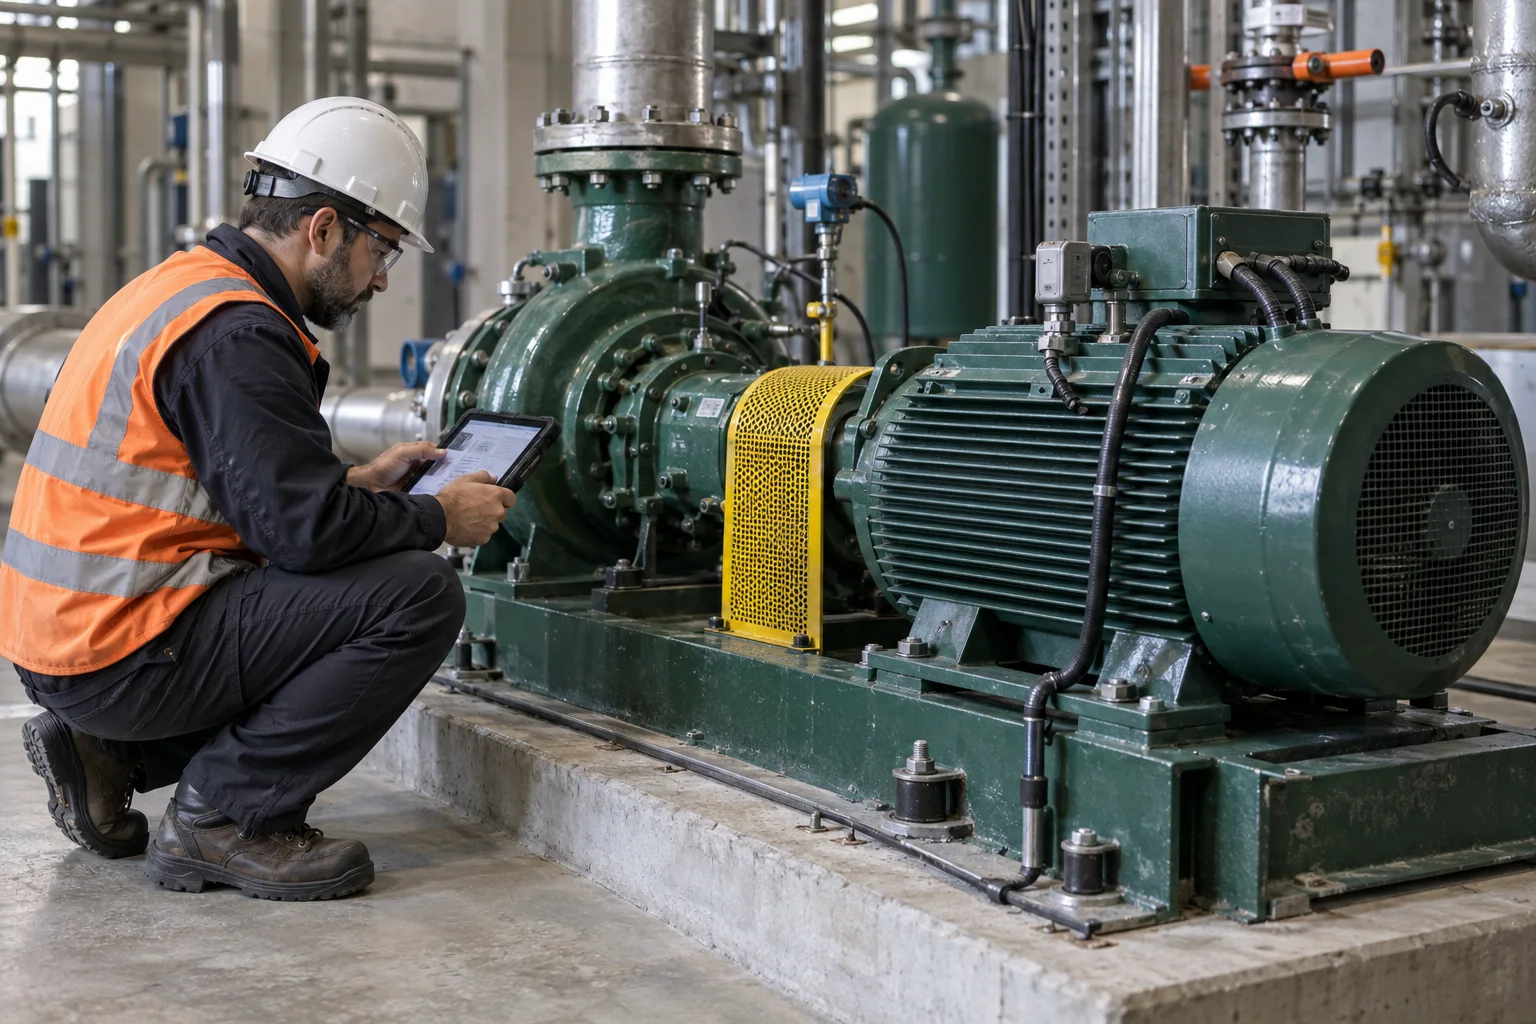 OVOO / INSIGHT 02
Maintenance priority should not be determined by alarm count alone. Risk, asset criticality, behavioral change and operational imp…
Read article ↗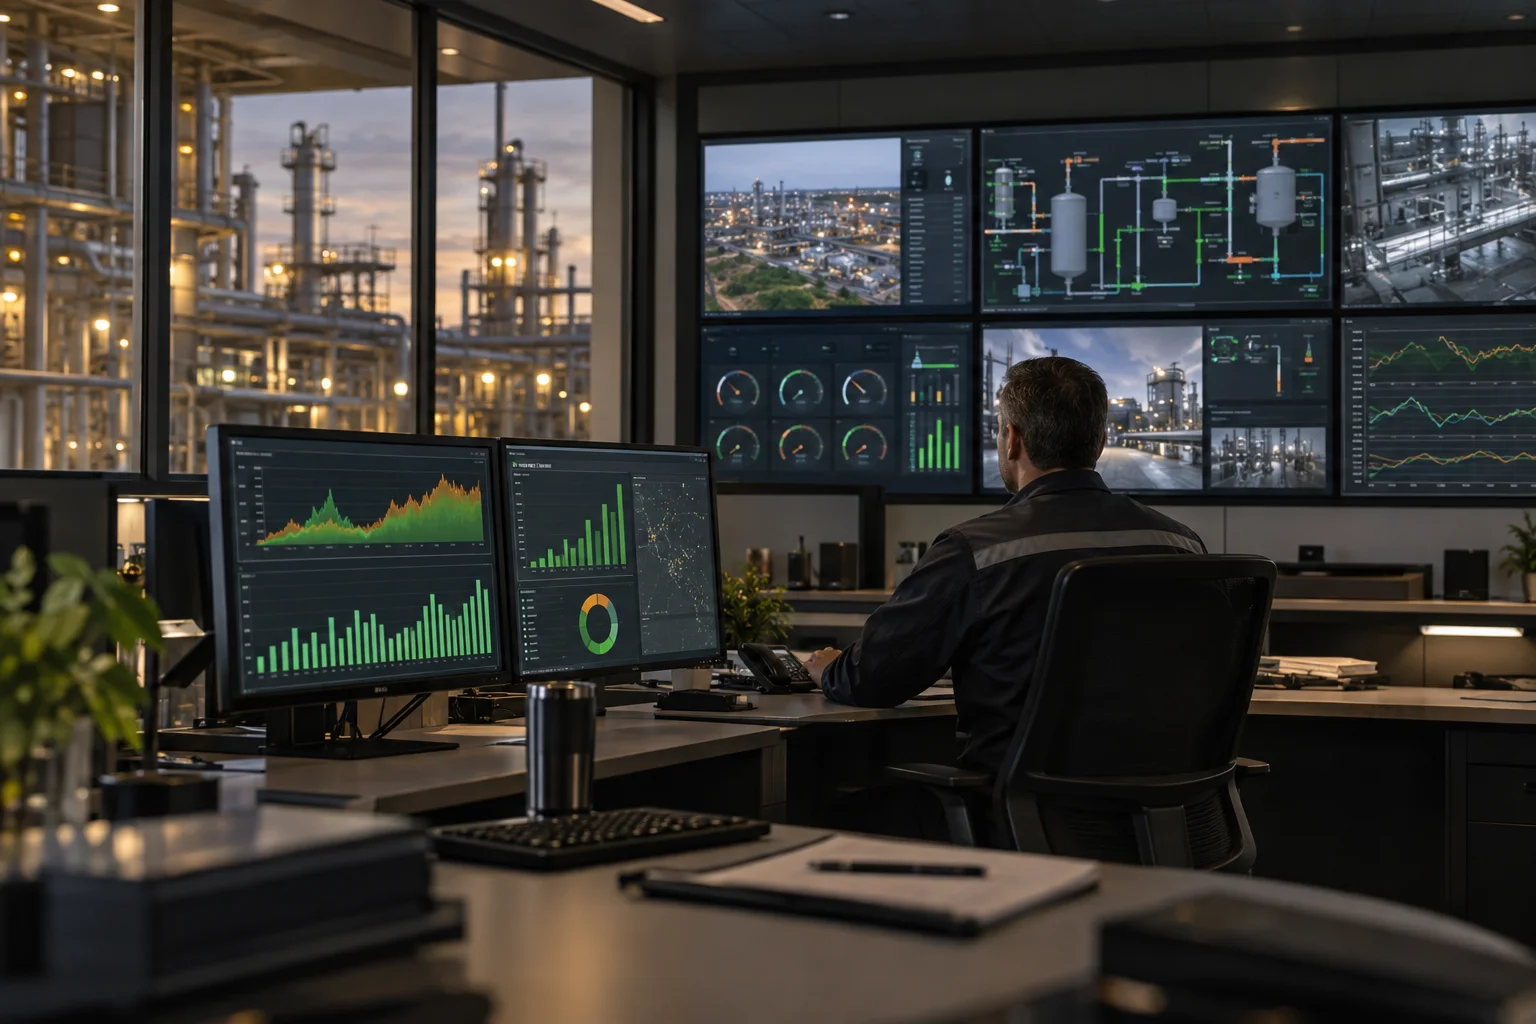 OVOO / INSIGHT 03
SCADA and Cinga are not replacements for one another. SCADA handles real-time monitoring and control, while Cinga adds a complemen…
Read article ↗Common questions about Cinga installation, its AI approach and integration with existing systems.
View all questions ↗No. Cinga is designed to complement existing SCADA and automation systems, not replace them. It adds historical behavior analysis, AI-supported interpretation, scores and decision support to the data already available.
Cinga can be used to monitor and analyze motors, pumps, electrical panels and other critical, energy-intensive equipment. Additional field parameters and sensors can be included according to the requirements.
AI is used to evaluate measurement data, an asset’s historical behavior and the relationships between different parameters together. The goal is not merely to display data, but to interpret changes and provide clearer outputs that users can apply in decision-making.
No. Cinga does not guarantee that every failure will be detected in advance. By analyzing how equipment behaves over time, it helps identify deviations from normal operation, recurring patterns and deterioration trends earlier.
Data collected and analyzed by Cinga is displayed through the central Cinga interface. Users can follow measurement data, historical behavior, analysis results, scores and related outputs in one place.