OVOO / ENERGY ANALYSIS AND DECISION SUPPORT

Cinga

Cinga is an AI-powered energy analyzer and decision support system developed in Türkiye for energy management. It supports more effective management of energy infrastructure and helps protect critical infrastructure and equipment.

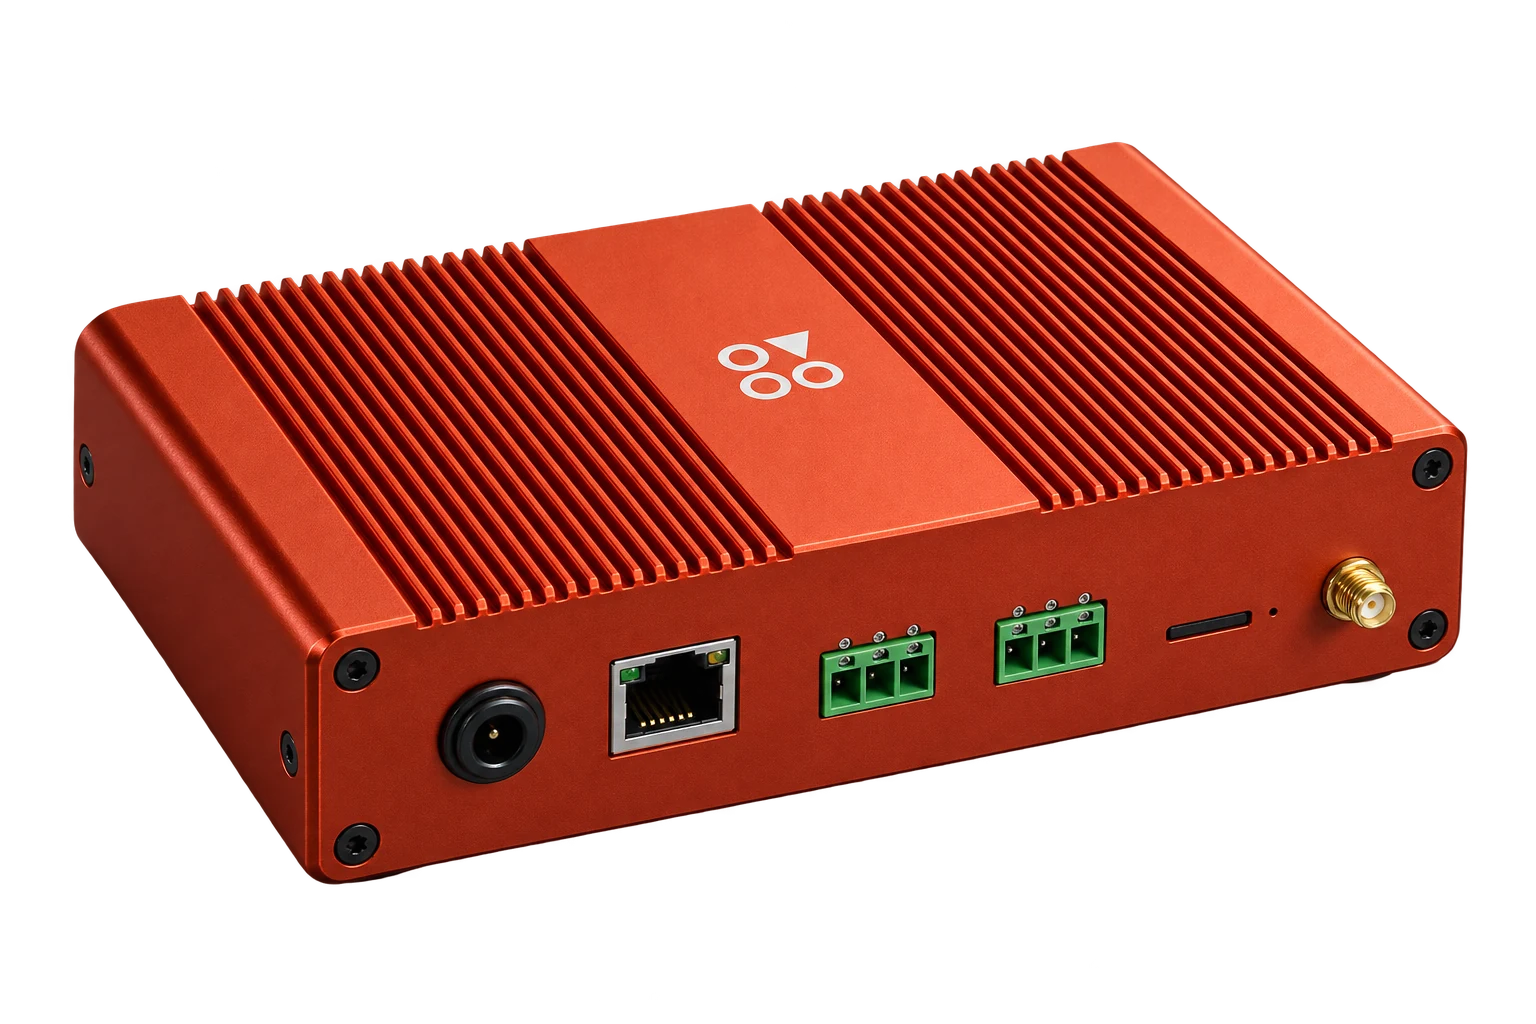
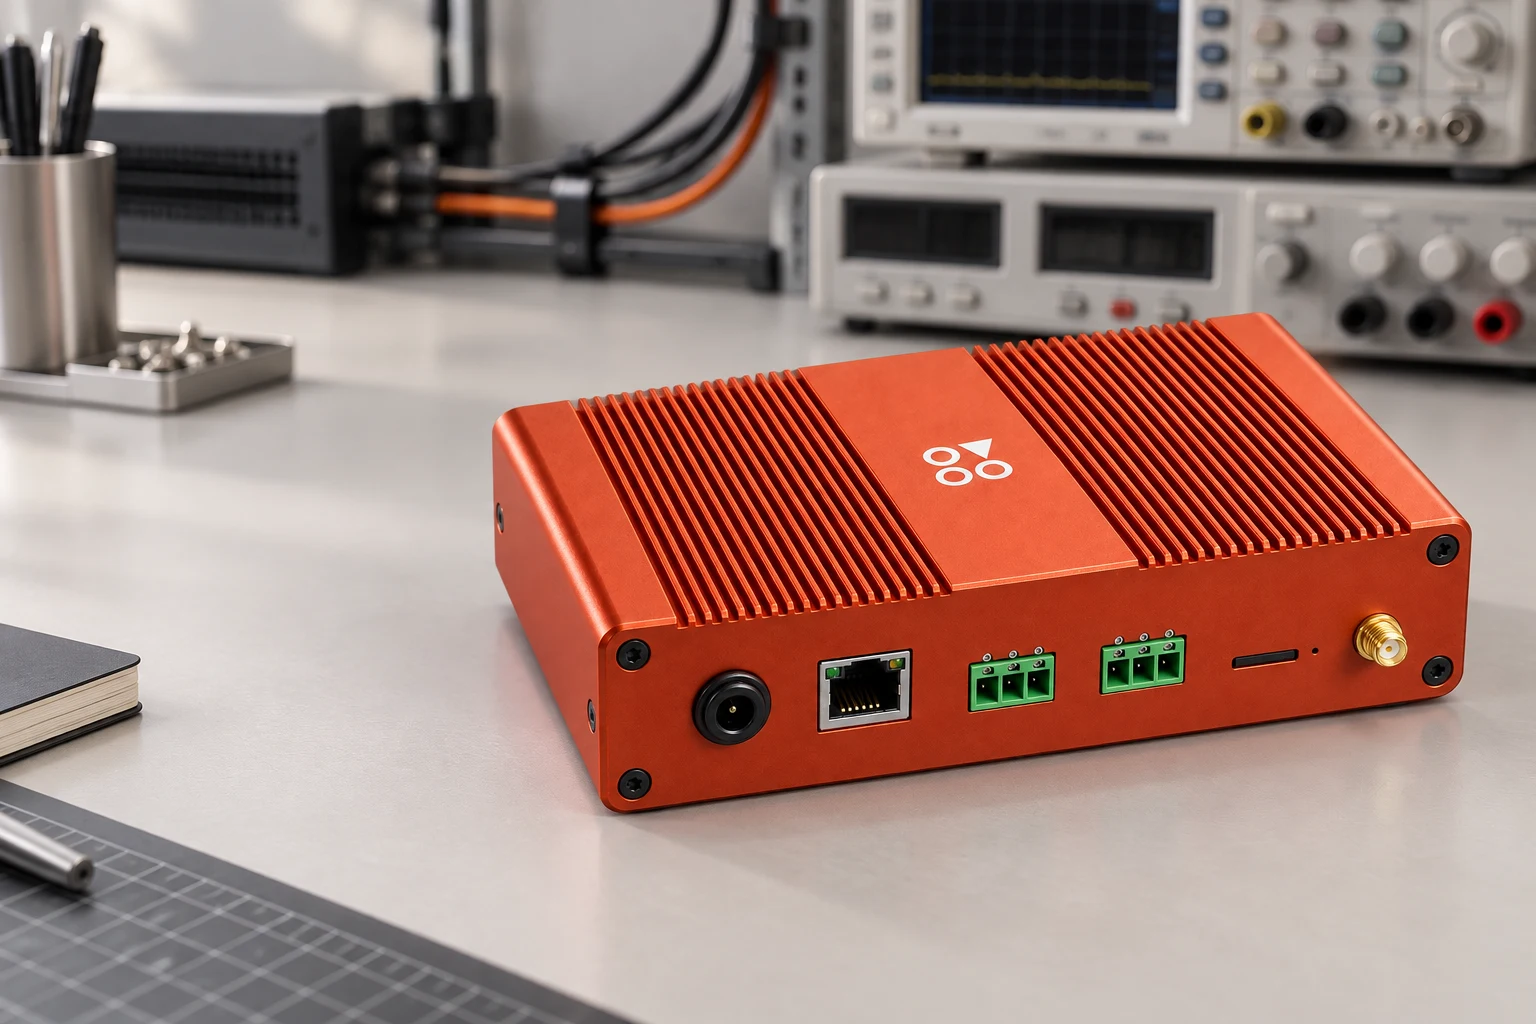
Orange anodized aluminum Cinga energy analyzer
GSM / IoT
Decision support
01 / MEET THE PRODUCT

What is Cinga?

Cinga is an AI-powered energy analyzer and decision support system developed in Türkiye for energy management. It supports more effective management of energy infrastructure and helps protect critical infrastructure and equipment.

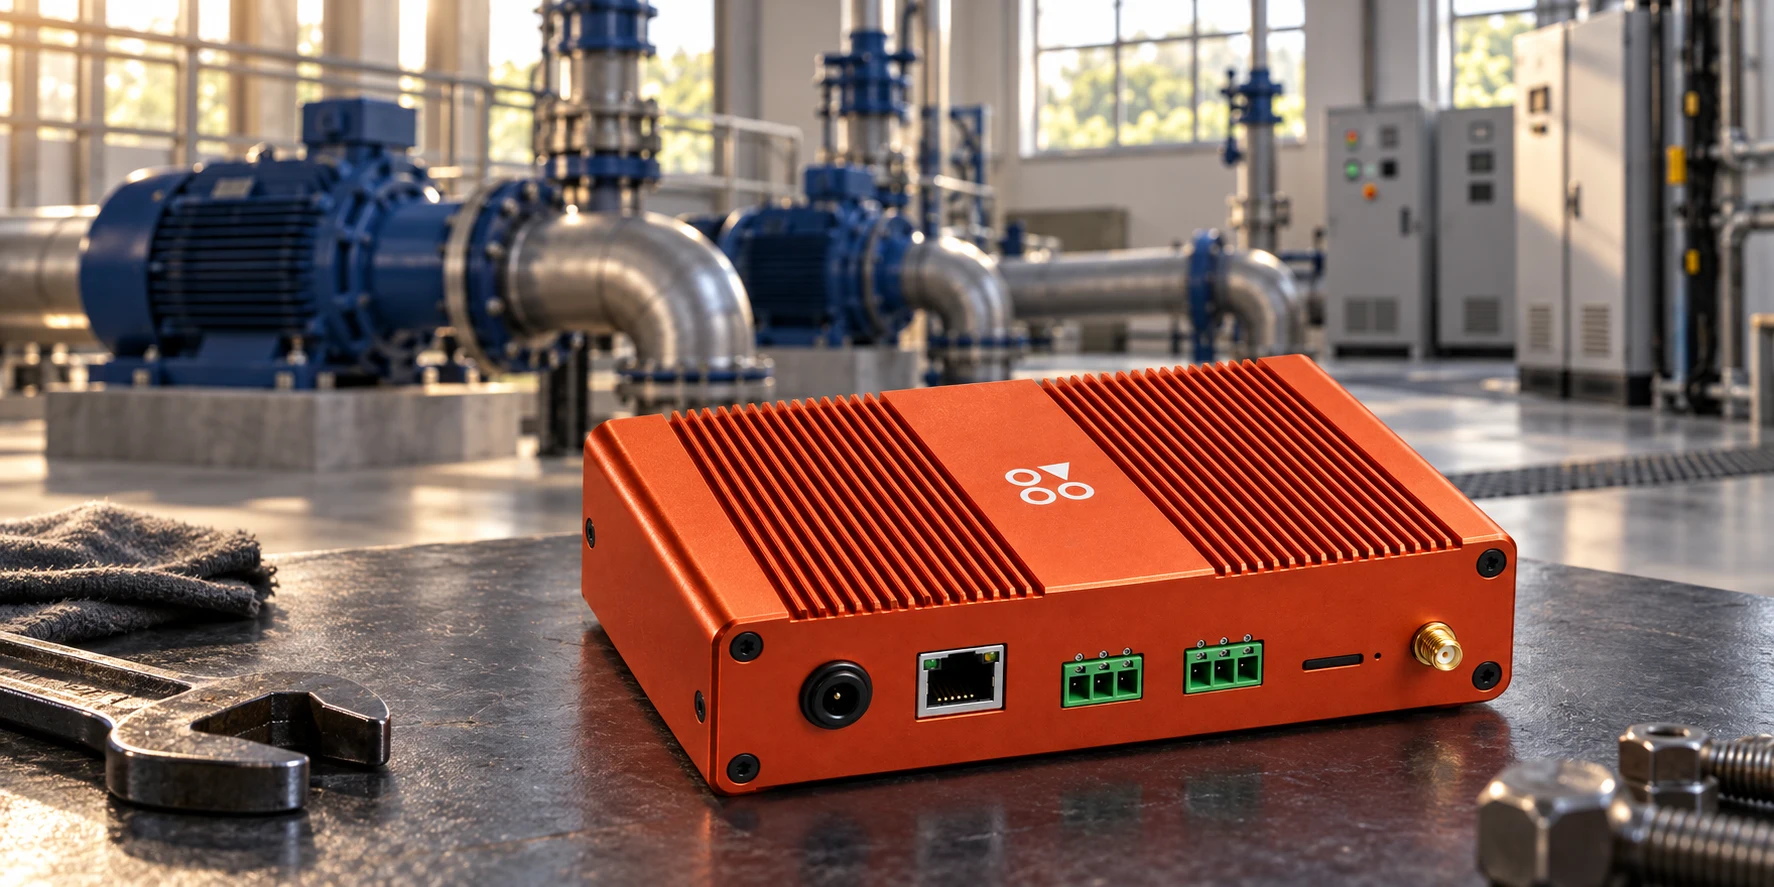
Cinga energy analyzer in an industrial pumping station setting
CINGALocal engineering. Holistic energy analysis.

A holistic view of energy

In energy-intensive facilities, Cinga aims to provide a holistic assessment of energy infrastructure and connected equipment alongside consumption monitoring. It goes beyond the instantaneous readings offered by conventional monitoring systems, helping businesses turn energy data into meaningful, understandable information they can use in decisions.
From data to meaningful indicators

Cinga evaluates electrical data through indicators and scores that matter to the business, rather than presenting only raw measurements. Energy management becomes a broader process in which energy quality, equipment behavior, efficiency, electrical condition and operational priorities can be assessed together.

A shared basis for every user

Cinga is designed for multiple levels of users: field technicians, maintenance and energy managers, business leaders and decision makers. By reducing the complexity of technical data, it helps different users draw meaningful conclusions from the same information and build a shared basis for decisions.

Cinga aims to turn energy data into information a business can understand, assess and use in its decisions, while contributing to the protection of critical infrastructure.

02 / HOW THE SYSTEM WORKS

How Does Cinga Work?

Cinga continuously monitors electrical data from the field and transforms it into meaningful results. Measurement, secure data transfer, central analysis, AI-assisted assessment and decision support operate as interconnected stages of an integrated system.

01

Field Measurement

Cinga devices collect electrical data from connected systems and equipment. Voltage, current, power, energy consumption and power factor are monitored continuously to reveal operating behavior over time. Assessment is based on historical patterns and changes as well as individual readings.

02

Secure Data Transfer

Field data is securely transferred to Cinga’s central infrastructure. Parameters are evaluated together and over time, enabling a more comprehensive assessment of normal operation, changes and conditions that may require attention.

03

Central Analysis + AI

Cinga’s analytics infrastructure and AI-assisted models process the collected data. Raw electrical values are evaluated under seven main scores: Grid Quality, Load Behavior, Reactive Power Management, Electrical Condition, Data Reliability, Efficiency and Motor Stress. Technical data becomes holistic indicators that users can interpret more easily.

04

Behavior and Trend Assessment

Cinga reveals equipment behavior and trends alongside its current condition. Relationships between different data points help identify deviations from normal operation and signs of deterioration, giving users earlier visibility into developments that may require attention.

05

Decision Support

Analysis and scores are presented through a central interface. Technical teams can access detailed electrical data and equipment behavior, while managers assess the facility through higher-level indicators. The same data infrastructure serves different users at the level of detail they need.

REGULAR VISIBILITY

Weekly Reports

Cinga also generates weekly reports covering the condition of the facility and equipment. Significant changes, scores, conditions requiring attention and key findings are brought together, allowing users to follow developments and priorities without constantly monitoring the system.

Cinga energy analyzer in an engineering lab

Cinga works end to end: securely transferring field data to the central system, analyzing behavior over time, interpreting it with AI support and presenting scores and weekly reports as actionable decision support.

03 / COMPARISON

Conventional Monitoring vs Cinga

Conventional MonitoringCinga
Instantaneous values and fixed thresholdsEquipment behavior over time
Alarm when a problem becomes evidentEarlier visibility into deterioration trends
Monitoring individual parametersAssessing multiple data sources together
Interpretation largely depends on personnelEngineering analysis + AI-assisted interpretation
Historical data mainly as a recordHistory + trend + behavior analysis
Priority depends on the userScores + intervention priority

CONVENTIONAL MONITORINGShows what happened.

CINGAShows what changed, why it matters and what needs to be done.

04 / HOLISTIC ASSESSMENT

Cinga’s 7 Main Scores

Cinga analyzes technical data from the field and systems to create understandable, comparable scores. Users can assess energy infrastructure and equipment from multiple perspectives through a holistic view alongside individual readings.

Grid Quality01 / CINGA
01

Grid Quality

Evaluates the quality of electricity supplied to a facility or equipment. Voltage deviations, balance between phases and harmonic distortion reveal the overall quality of the supply, helping identify grid-related issues and power quality problems that could affect equipment.

SUB-ASSESSMENTSVoltage Level ScoreVoltage Magnitude Balance ScoreHarmonic Distortion Score
Load Behavior02 / CINGA
02

Load Behavior

Evaluates how equipment behaves under electrical load. Load level, phase current balance, current waveform, power conversion and operating stability are assessed together, making deviations from normal operation, unbalanced loading and changes in behavior easier to recognize.

SUB-ASSESSMENTSLoading ScorePhase Current Balance ScoreCurrent Waveform ScorePower Conversion ScoreOperating Stability Score
Reactive Power Management03 / CINGA
03

Reactive Power Management

Evaluates reactive power behavior and compensation performance. Power factor, reactive imbalance between phases and compensation stability are assessed together, making deterioration in reactive energy management and compensation issues easier to see.

SUB-ASSESSMENTSPower Factor Level ScorePhase Reactive Imbalance ScoreCompensation Stability Score
Electrical Condition04 / CINGA
04

Electrical Condition

Provides a high-level view of the overall electrical condition of equipment or a monitored point. It combines grid quality, load behavior and reactive power management, giving users a holistic overview without having to review every individual sub-score.

HIGH-LEVEL SUMMARYHigh-level summary: Grid Quality + Load Behavior + Reactive Power Management
Data Reliability05 / CINGA
05

Data Reliability

Evaluates the quality of the data underpinning Cinga’s analysis. Completeness, timeliness, consistency and historical traceability are checked, allowing users to assess both the analysis and the reliability of its underlying data.

SUB-ASSESSMENTSCompleteness ScoreTimeliness ScoreConsistency ScoreTraceability Score
Efficiency06 / CINGA
06

Efficiency

Evaluates the performance equipment or a system delivers in relation to its energy use. For pumps and similar systems, it looks at how effectively energy is used as well as how much is consumed. Comparing current performance with reference values helps track changes in efficiency and deterioration in energy performance.

SUB-ASSESSMENTSWire-to-Water Efficiency ScoreReference-Based Energy Performance Score
Motor Stress07 / CINGA
07

Motor Stress

Evaluates the electrical stress a motor experiences during operation. Changes in electrical behavior and deviations from normal operating characteristics help reveal potential stress, enabling users to monitor the health of operating conditions alongside whether the motor is running.

Cinga aims to turn extensive technical data into understandable, comparable outputs that can be used in decisions.

OPERATIONAL VALUE

Benefits of Cinga

Cinga’s value goes beyond producing more data. Remote detection, early warning, historical analysis and measurable management help businesses manage energy, maintenance, downtime and field operations more effectively.

01

Remote Detection and Intervention

Cinga enables remote monitoring of equipment, detection of adverse behavior before problems escalate and remote intervention in authorized scenarios.

02

Reduced Unplanned Downtime Risk

Helps reduce the risk of unexpected downtime and service loss in critical equipment.

03

Visibility into Energy Inefficiency

Makes inefficient equipment and unusual consumption behavior visible.

04

Power Quality Monitoring

Monitors phase imbalance, power factor, reactive behavior and harmonics.

05

Informed Maintenance Priorities

Helps direct maintenance resources to equipment that requires inspection.

06

Effective Use of Field Teams

Can help reduce unnecessary site visits, vehicle mileage and staff time.

07

Control of Energy Costs

Enables equipment-level investigation of energy losses and inefficiency.

08

Reactive Energy Penalty Risk Monitoring

Supports penalty risk management by monitoring power factor and reactive energy behavior.

09

Control of Maintenance Costs

Can help reduce emergency maintenance, repeat interventions, spare parts and labor costs.

10

Historical Analysis

Allows historical data to be examined to understand when and under what conditions a problem occurred.

11

Organizational Memory

Creates a recorded technical history, reducing dependence on individual experience for field knowledge.

12

Measurable Management

Enables data-based answers to “why did it happen and what was done?” alongside “what happened?”.

06 / APPLICATIONS

From critical infrastructure
to industrial operations.

Suitable measurement points and equipment are identified through a site survey. Solutions are designed around actual facility conditions.

01

Public / Critical Infrastructure

Water and wastewater utilities, municipalities, pumping stations, distributed energy monitoring points and public facilities.

02

Commercial / Industrial

Manufacturing facilities, industrial zones, motor- and pump-intensive businesses, energy-intensive operations and distributed sites.

DATA SECURITY AND SOVEREIGNTY

Critical infrastructure data is protected within a secure, controlled architecture.

Cinga is developed to securely transfer and store critical infrastructure data and make it accessible only to authorized users. Data security and data sovereignty are fundamental elements of the system architecture.

01

Türkiye-Based Data Infrastructure

Depending on organizational and project requirements, Cinga data can be hosted on servers and cloud infrastructure located in Türkiye. The location of data storage can be clearly defined and controlled within each project, especially for public bodies and critical infrastructure operators.

02

Secure and Independent Data Communication

Field data can be securely transferred to the central system over GSM/IoT infrastructure. Communication can be configured independently of the organizational network, reducing the need for direct connections to existing corporate networks.

03

Controlled and Authorized Access

Access to the system and data can be managed by role. Permission levels define the data and information each user can access, keeping access to critical data under control.

04

Local Engineering and Data Sovereignty

Cinga’s electronic design, embedded software, backend infrastructure, analysis algorithms and decision support layer are developed by OVOO in Türkiye. This approach aims to reduce external dependence in critical infrastructure technology and data management and strengthen data sovereignty.

05

Blockchain-Based Record Integrity

Cinga uses a blockchain-based record approach to strengthen the integrity and traceability of critical data records created at defined intervals. It supports verification of record integrity over time and a reliable record chain for assessments of historical data.

FREQUENTLY ASKED QUESTIONS

Clear answers
to technical questions.

View all questions ↗
01Does Cinga replace the existing SCADA system?+

No. Cinga is designed to complement existing SCADA and automation systems, not replace them. It adds historical behavior analysis, AI-supported interpretation, scores and decision support to the data already available.

02Which types of equipment can Cinga monitor?+

Cinga can be used to monitor and analyze motors, pumps, electrical panels and other critical, energy-intensive equipment. Additional field parameters and sensors can be included according to the requirements.

03What is artificial intelligence used for?+

AI is used to evaluate measurement data, an asset’s historical behavior and the relationships between different parameters together. The goal is not merely to display data, but to interpret changes and provide clearer outputs that users can apply in decision-making.

04Can Cinga detect every failure in advance?+

No. Cinga does not guarantee that every failure will be detected in advance. By analyzing how equipment behaves over time, it helps identify deviations from normal operation, recurring patterns and deterioration trends earlier.

REQUEST A DEMO

Let’s discover what
your energy data reveals.

Request Demo